Forex trading relies heavily on technical analysis, and at the core of this analysis are Forex charts. Whether you’re a beginner or an experienced trader, understanding how to read and interpret these charts is crucial for making informed trading decisions. In this guide, we’ll break down the basics of Forex charts, their types, key elements, and how to use them effectively.
What is a Forex Chart?
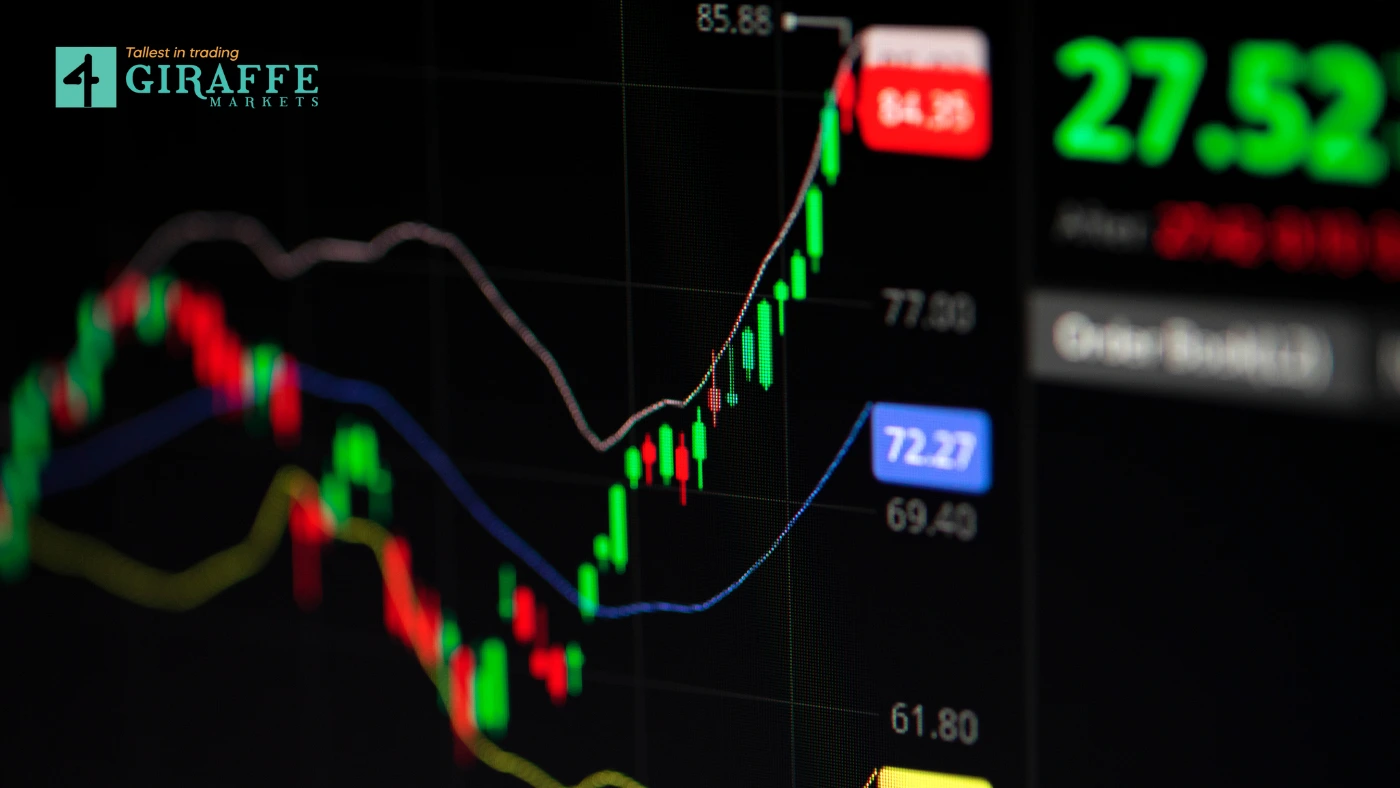
A Forex chart is a visual representation of currency price movements over a specific period. These charts help traders analyze trends, identify patterns, and predict potential price movements.
Forex charts are plotted based on timeframes (such as 1-minute, 1-hour, or 1-day) and show price fluctuations within that period. Traders use them to decide when to enter or exit trades.
If you want to access real-time Forex charts, check out TradingView – one of the best platforms for live market analysis.
Types of Forex Charts
📈 1. Line Chart
A line chart is the simplest form of a Forex chart. It connects the closing prices over a selected timeframe with a continuous line.
✅ Best for: Identifying overall trends quickly.
❌ Limitation: Doesn’t show price fluctuations within the period (such as highs and lows).
📊 2. Bar Chart
A bar chart provides more details than a line chart, displaying the open, high, low, and close (OHLC) prices for each time period.
✅ Best for: Seeing price fluctuations within each trading period.
❌ Limitation: Can be complex for beginners.
🕯️ 3. Candlestick Chart (Most Popular)
A candlestick chart also displays OHLC prices but in a more visual and readable way. Each candlestick consists of:
- Body (shows the opening and closing price)
- Wicks (Shadows) (show the highest and lowest price in that timeframe)
- Color (Green/White = Price Increased, Red/Black = Price Decreased)
✅ Best for: Identifying patterns, trends, and market psychology.
❌ Limitation: Requires some learning to fully understand.
Key Elements of a Forex Chart
1. Timeframes
Forex charts can be viewed in different timeframes, ranging from 1-minute charts to monthly charts. The choice depends on your trading strategy:
⏳ Short-Term Traders (Scalpers & Day Traders) – Use 1-minute to 15-minute charts.
📅 Swing Traders – Use 1-hour to daily charts.
📆 Long-Term Investors – Prefer daily, weekly, or monthly charts.
2. Price Levels & Axes
- Vertical Axis (Y-Axis): Represents the price of the currency pair.
- Horizontal Axis (X-Axis): Represents time.
3. Support & Resistance Levels
🔹 Support – A price level where the currency tends to stop falling and bounce back up.
🔹 Resistance – A price level where the currency tends to stop rising and reverse downward.
Identifying these levels helps traders make better entry and exit decisions.
Common Chart Patterns Traders Use
1. Trendlines
Trendlines help visualize the direction of the market:
📈 Uptrend – A series of higher highs and higher lows.
📉 Downtrend – A series of lower highs and lower lows.
➖ Sideways (Range Market) – The price moves within a set range without clear direction.
2. Candlestick Patterns
Some popular candlestick patterns include:
- Doji – Indicates market indecision.
- Engulfing Candles – Sign of trend reversals.
- Hammer & Shooting Star – Indicate potential trend changes.
3. Chart Patterns
- Head & Shoulders – Signals trend reversals.
- Triangles & Flags – Indicate potential breakout opportunities.
How to Read Forex Charts Like a Pro
📌 Step 1: Choose the Right Chart Type – Beginners can start with candlestick charts.
📌 Step 2: Identify Trends – Look at trendlines and moving averages.
📌 Step 3: Spot Key Support & Resistance Levels – Use past price movements to identify areas of interest.
📌 Step 4: Recognize Patterns – Use candlestick and chart patterns to predict future moves.
📌 Step 5: Apply Indicators (Optional) – Moving Averages, RSI, and MACD can provide additional insights.
Final Thoughts
Learning to read Forex charts is a fundamental skill for any trader. By understanding chart types, trends, support/resistance levels, and key patterns, you can improve your decision-making and increase your chances of success in the Forex market.
At Giraffe Markets, we provide advanced charting tools and resources to help traders analyze the market effectively.
📈 Start Trading Today with Giraffe Markets! 👉 www.giraffemarkets.com
If you have been into the FX trading market for quite a while but you haven’t yet started using a comprehensive platform for financial markets, we suggest practicing with a demo account first. With a Giraffe Markets demo account, you can gauge real market conditions without financial risk, hone your strategies and understand market dynamics to become an expert trader sooner or later.
Follow us on Facebook, Instagram, Twitter, Linkedin, Reddit, YouTube, Quora, Threads, and Tiktok for more daily updates.